
The AI Platform Map, part 6 of 6
Stop Measuring How Much AI You Use. Measure What Gets Trusted
Platform architecture, 2026
The biggest mistake an engineering organization can make right now is measuring how much AI it uses.
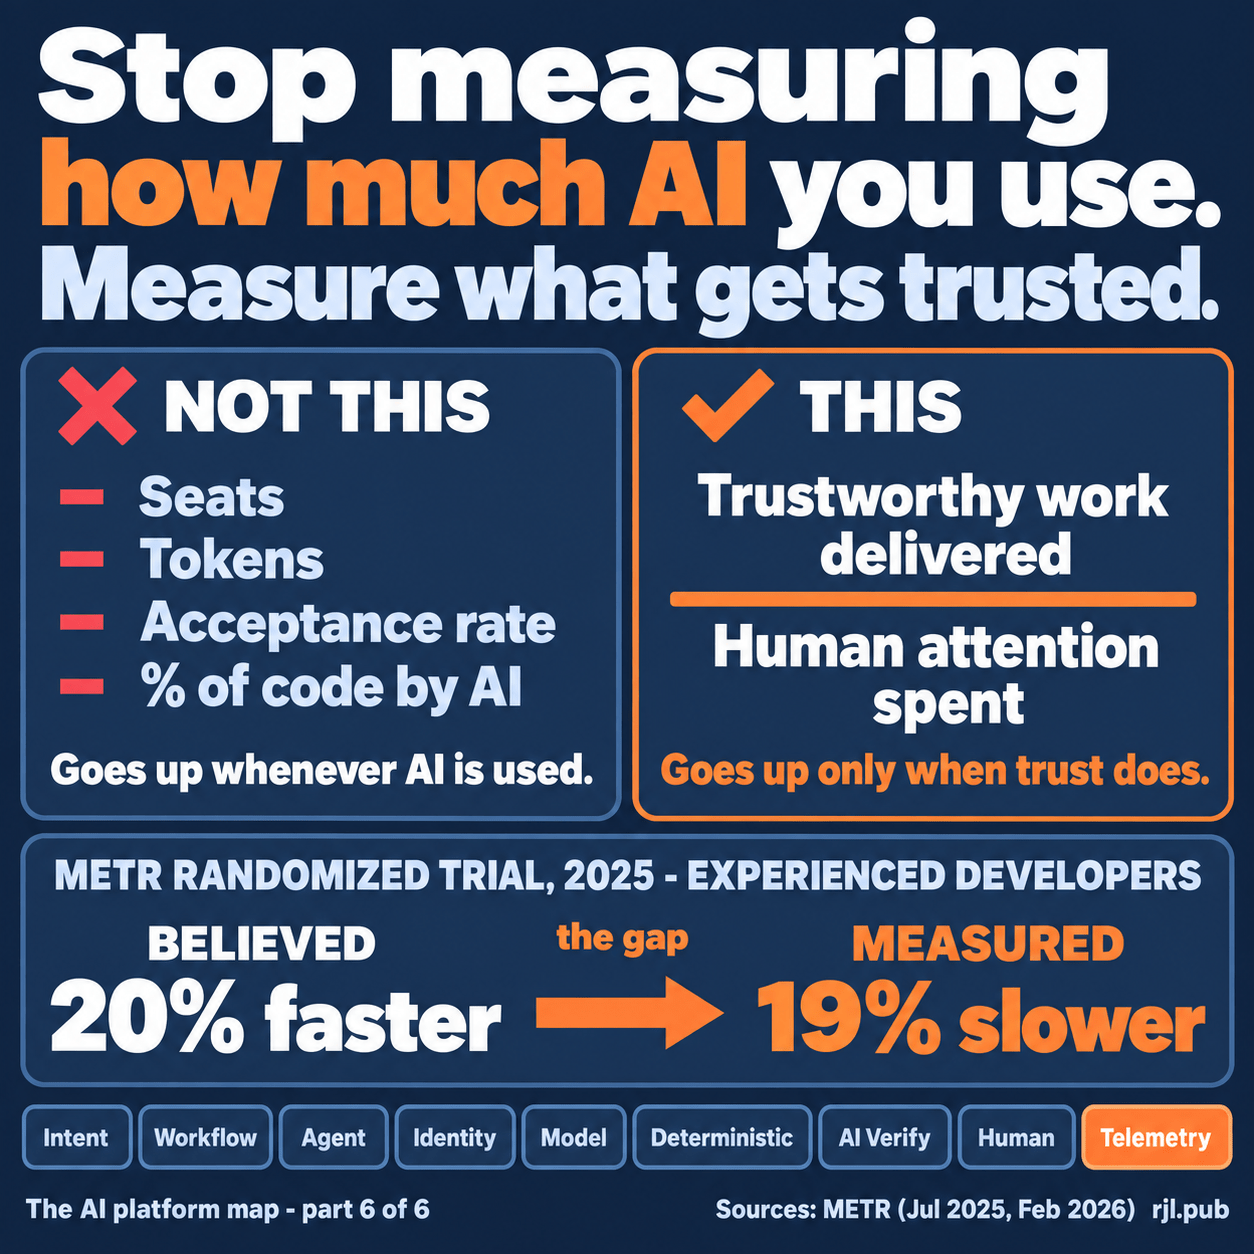
Seats activated. Tokens consumed. Suggestion acceptance rate. Percentage of code written by AI. Number of agents running.
Every one of those goes up when people use more AI. None of them tells you whether anything got better.
That is a vendor's dashboard, not an engineering one.
Usage and outcomes can point in opposite directions
In METR's 2025 randomized trial, experienced open-source developers took 19% longer to finish tasks when AI was allowed. Beforehand they predicted a 24% speedup. Afterward they still believed they had been 20% faster.
Usage said yes. Perception said yes. The clock said no.
I am not citing that to argue AI slows people down. Tools have moved since, and METR's 2026 follow-up had to redesign the study, partly because developers no longer wanted to work without AI at all. That is exactly the point. You cannot feel your way to this number, and you cannot read it off a usage report.
Measure the thing that is actually scarce
Generation is abundant now. Human attention is not. So the metric has to put human attention in the denominator.
Trustworthy work delivered, per unit of scarce human attention.
Trustworthy work: changes that reached production, did what the written intent said, and stayed good. No rollback, no incident, no escaped defect inside a window you choose.
Human attention: the minutes people spent writing intent, reviewing, handling exceptions, and cleaning up rework.
If the ratio climbs, the investment is working. If usage climbs and the ratio does not, you bought activity.
This is the last layer of the map: outcome telemetry
It closes the nine-layer platform map I have been walking through. Telemetry is not a quarterly report. It is the feedback loop that makes the other eight layers smarter.
- Outcomes by verification path. Changes cleared by deterministic checks alone, by independent AI review, by a human. When one path starts letting defects through, tighten it.
- Human hit rate. Of the changes routed to a person, how often did that person find something that mattered? Near zero means you are wasting them. Very high means the layers in front of them are weak.
- Outcomes by model and by workflow. That is how a model swap becomes a measured decision instead of a debate.
- Rework within 30 days. The quiet cost that never shows up in a velocity chart.
I have argued before for tracking verification time as its own line item. This is the rest of that dashboard.
Trust gets earned per path, from evidence, and adjusted as the evidence comes in. It does not get granted per tool because the demo went well.
One ask
Open your AI dashboard. If every number on it goes up when people simply use more AI, replace one of them this quarter with a number that only goes up when trustworthy work does.
AI made generating software cheap. The organizations that pull ahead will be the ones that made believing it cheap too.
What is on your AI dashboard today?